 The science behind both uniting and dividing provides interesting insights into why people become isolated from one another, and how uniting can empower people to live richer, fuller lives. We will first explore the science behind why people divide. We will then look at the science behind understanding one another in order to come together and unite. Both provide interesting and useful perspectives.
The Science Behind How And Why People Often Divide
 Since the beginning of our species mankind has organized itself into groups of individuals who share common beliefs, values, languages, and experiences. Usually due to both a common heritage and culture. Over centuries of time these distinct cultures have evolved into complex sets of mores, governing the social interactions of entire civilizations. Which according to Paul James gives these civilizations common ground and reinforces their peaceful coexistence. (James P., 2006)
Unfortunately though the very same forces that give rise to enduring civilizations that span thousands of years, also create friction between civilizations that can lead to devastating wars. This is often the case when two dissimilar cultures come into contact with one another. Especially when both cultures are mature and have evolved over long periods of time.
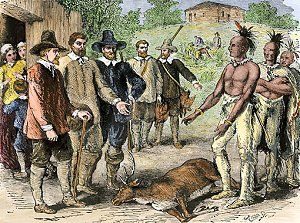 Consider for example the impact of one culture discovering another dissimilar but equally successful culture. Where the people’s values stand in stark contrast to those values held by themselves. How can a culture tolerate or understand another culture that is equally successful? The very notion that there is more than one way for a society to function can be jarring and threatening. Especially to those in power. Leaving the people of either or both cultures with serious religious and intra-societal issues to come to terms with. Either these people must admit that the other culture is as valid as their own, or they must declare that the other culture is evil in some way. Sure, they might be successful, but their success comes at the expense of righteousness. They can then declare that because they value goodness, and those principles which their forefathers have maintained for generations, that they are blessed and the other culture is cursed. As such, the values of the other group can be declared to be destructive, and a threat to all those who stand up for what is right.
It is not hard to see how these binding ties that glue a civilization together can also lead people towards inevitable conflict with those around them. Such has been the case throughout history. Civilizations demanding that those around them succumb to their way of life, rather than showing tolerance or understanding.
Andy Bennett, a researcher in Great Britain refers to this phenomena as tribalism. (Bennett A., 1999) Of course Mr. Bennett isn’t the first to use this term, however his research suggests that the same phenomenon that plays out on the macro-scale, spanning centuries of time, also occurs on the micro-scale, across months, and at times even weeks. Mr. Bennett suggests that groups which he refers to as neo-tribes can form wherever a small number of people allow themselves to become isolated and insulated from the rest of society.
 This isolation can take the form of choosing to socialize with only those individuals from the same small group of friends, only interacting online with like-minded individuals, only getting news from a single source, or only consuming certain types of media. Such acts of insulation move to further propel a group from the rest of society, creating a subculture whose values are distinct from those of the larger population.
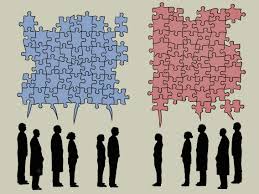
Andrea Braithwaite argues that it is both in and between these types of neo-tribes that cultural wars begin to break out. (Braithwaite A., 2016) As with the great civilizations of the past, the differences between two neo-tribes can be profound. Each side having spent weeks, months, or years insulating themselves within a group of like minded individuals, self-reinforcing their own views. As these groups discuss their perceptions and have their biases confirmed, these beliefs are expanded and constructed into shared realities. Thus, it can be very jarring to members of one tribe to come across another whose values run in stark contrast to their own. They are left with the same dilemma as those great civilizations of the past. They must either admit that the other side’s way of viewing the world is as valid as their own, or they must fight back. Declaring that the other side is wrong, and that they are either stupid, or purposefully deceitful.
 In the past, socialization was confined by time and location. It evolved slowly, and was constrained by inheritance. While these rules still apply in the larger context of culture, they no longer apply to the rapidly evolving realities of subcultures. Thanks to modern technologies like the Internet, cellphones, and social media, people are forming affiliations with neo-tribes from all over the world.
Akaine Kanai from The School of Social Sciences And Humanities at The University of Newcastle in Callaghan, Australia argues that these groups often start off with a single humble idea. Such as by someone who starts writing on a blog. (Kanai A., 2017) From these small beginnings entire communities can spontaneously emerge. Such as when other bloggers join in and begin to write about the same or very similar topics. These bloggers then promote their audiences between each other, and reinforce the other’s writing. In a very short period of time an entire community of both influencers and listeners or ‘lurkers’ as Kate Crawford refers to them (Crawford K., 2009) develops around the initial concept. What began as a single writer expressing their thoughts to an almost nonexistent audience often grows into a viral phenomenon with followers all over the world.
These groups become increasingly similar to one another as time goes on, while at the same time growing more distinct from the rest of society. (Cova, B., & Cova, V., 2002) Making it very challenging for them to listen to or effectively communicate with those outside of their group. Especially when they hold contrary views. (Crawford K. 2009) (Christopher C. Gearhart, Sarah K. Maben., 2019)
 This can become especially challenging when individuals in the real world share close physical associations, while belonging to different neo-tribes online. Such as coworkers, neighbors, and family members. Where they are exposed to the thoughts and beliefs of each other during the course of their regular interactions. (Sharon L. Storch, Anna V. Ortiz Juarez-Paz., 2018) It is, for example, not uncommon for coworkers to connect online via social media. Likewise, families often use social media as a means of sharing pictures and news about each other’s lives. While these interactions offer participants powerful tools for keeping in touch and for getting to know each other better, they also tend to shine a bright light on our individual differences.
Given that our neo-tribe affiliation is no longer bound by location, the neo-tribes that we participate in are very often not the same tribes that our family members, or coworkers belong to. As this becomes evident in both our social media posts, and also through the posts of the other person, it is not uncommon for the innate trust that we once felt for these people to decay and to be replaced by animosity. (Robards, B., & Bennett, A., 2011) Making it very hard for us to respect those individuals either online or offline. (Margaret C. Stewart, Christa L. Arnold., 2018)
To mitigate this, and protect individuals from having their views made public, it is not uncommon for people to create pseudonyms which they then use to hide their identity. This can be an effective means of protecting oneself from having their views discovered by others. However, it often leads to the individual feeling emboldened. Such that they engage in increasingly jarring language. Leading to more damage being done to public discourse. (Van Der Nagel, E., & Frith, J, 2015)
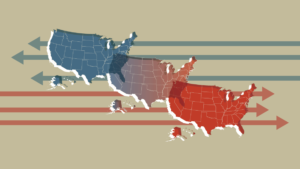
 Nowhere is this phenomenon more prevalent than with politics. Almost everyone belongs to a variety of online neo-tribes. Whether they revolve around something as significant as our religion, our occupation, or our sexual orientation. Or whether they revolve around something as mundane as cloth diapers, bass fishing, or playing the xaphoon. However, nothing is more universal, at least in The United States than are the two political parties that dominate our culture. Even accounting for a variety of lesser political parties, all of them can still be divided across a single gradient. Which is that of being either conservative, or liberal. While some do truly stand in the middle, almost all of us, if pressed, could place ourselves into one of these two tribes.
While it is unlikely that the ethos of the bass fishing community will ever run counter to the ethos of mothers who advocate the use of cloth diapers, it is inevitable that there will be constant friction between those who consider themselves to be liberal and those who consider themselves to be conservative.
Both conservatives and liberals tend to isolate and insulate. So that they largely interact with like minded people. This often includes who they date, who their friends are, and from where they get their news. (Ariel Pomputius., 2019) (Margaret C. Stewart, Christa L. Arnold., 2018) When these two groups come together online the consequences are often tremendous and negative. (Mills, R. A.,2017) Causing stress within families, divisions within workplaces, and increased animosity within society in general.
 Interestingly the political party that individuals belong to, often does not coincide with their beliefs or ideology. Frequently studies show that people belong to the party that their parents belong to, or that their social group approves of. Thus, it is not uncommon for these individuals to get very angry at the other tribe, while actually sharing many or most of the same views.
Research also shows that members of a political party often tend to take their cues on how to respond to new situations from the leadership of their respective parties. So that their responses are based in tribal loyalty rather than in their own beliefs and ideology. Which is why it is not uncommon to see parties take over an issue from another party, only to then see the other party abandon the issue and suddenly oppose something that they used to support.
Two more reasons, in addition to tribalism also divide the public. These will be discussed in the next section.
The Science Behind How We Can Understand One Another And Unite

Introduction
In a politically divisive climate where members of different political ideologies are moving against each other with increasingly fierce animosity. Identifying what drives misunderstandings between the two main political ideologies (conservative and liberal) and working to heal that divide has never been more important. In an effort to understand the driving forces behind this divide, the researcher identified and explored two distinct ways that people interact with knowledge. The first will be termed as knowledge seeking throughout this article, and refers to the sources that individual’s trust as they look to acquire truth. The second domain will be termed as knowledge chaperoning throughout this article, and refers to how a person weighs the value of the various solutions to a problem. In order to fully understand this topic and the potential significance of the results, we must first briefly explore these two domains in greater detail. Beginning with knowledge seeking.
How human beings learn is not a topic that is new to science. Researchers have been developing theories surrounding the processes involved in learning for as long as we have gathered in complex societies. As far back as ancient Greece Socrates, Aristotle, and Plato provided generations of teachers with best practices in the field of education. Important contributions in modern times provided teachers with tools to understand the psychology of learners, the methods of organizing instruction, and how to motivate students. These include Maslow, (Maslow, 1943) Bloom and Webb, (Bloom, 1956) (Webb, 2005) B. F. Skinner (Skinner, 1938) and many others. In more recent years, a great deal of research has also explored the positive correlation that exists between perceived teacher trustworthiness and how effectively students learn. (Goddard, 2000) Making it clear that learners are much more willing to learn content from sources that they deem as trustworthy. Extending this concept of trust into the domains of religion vs science is also not new to researchers.
Peter Harrison of the University of Chicago argues that the domain of modern science mainly revolves around answering questions relating to how the Universe functions, while the domain of religion revolves around answering questions relating to why the Universe exists. (Harrison, 2015) He suggests that while distinct and firm, this division is relatively new, and only evolved over the past 300 years. Prior to the modern era the questions of both how and why the Universe functioned as it does were answered equally by the same authorities. Barbour argues that this division became prominent in western society starting with the trial of Darwin in Great Britain and that it has continued ever since. (Barbour, 2000) With many since that time viewing science and religion as being mutually exclusive from one another.
With this in mind, let’s now return to the focus of this study. Given that religion and science are both important aspects of modern life, that these institutions have been divided from each other in the modern era, and that they still each actively promote themselves often competing with each other as the ultimate source for knowledge, it is not surprising that this dynamic would serve as a means of creating societal division within the larger culture. With those more inclined to trust religion falling on one side of a gradient and those more inclined to trust science falling on the other.
As each of these self-declared ultimate sources of knowledge actively lobby individuals to their side, it is likewise understandable that individuals would feel a great deal of tension even within themselves. Especially when these two sources appear to take opposite sides of an issue such as has been the case with issues like teaching evolution in public schools, abortion rights, same sex marriage, and so forth. Thus, religion vs science have created one axis of division in American politics. Which as stated earlier for the purpose of this study will be termed as “knowledge seeking,” or how individuals seek and trust knowledge. Ie, are they more inclined towards trusting religion, or are they more inclined towards trusting science.
A second axis of division exists in modern American politics, and relates to how individuals chaperone their knowledge. There is still much debate within the scientific community regarding the role that ideology plays in determining the political party that a person ultimately affiliates with. With some of the research indicating little or no correlation between the ideology of a person and their political party (Malka, A., Lelkes, Y., 2010)(Baldassari, D., & Gelman, A., 2008) while other evidence shows that both ideology and personality do at least partially impact the political affiliation of individuals. For example, Carney, D. R., Jost, J. T., Gosling, S. D., & Potter, J. found that liberals tended to be more open-minded, creative, curious, and novelty seeking, whereas conservatives tended to be more orderly, conventional, and better organized. (Carney, D. R., Jost, J. T., Gosling, S. D., & Potter, J. f, 2008) Ashton, M. , Paunonen, S. , Helmes, E. , & Jackson, D. found that liberals tended to be more compassionate while conservatives tended to be more polite. (Ashton, M. , Paunonen, S. , Helmes, E. , & Jackson, D., 1998) These and other similar studies seem to draw the same continuum between conservatives and liberals. Though they each name or label that continuum differently. For the purpose of this study this gradient will be referred to as compassion vs logic.
While there is data supporting a correlation between the political party and the level of compassion or logic that an individual exhibits, what is unclear from current research is how people chaperone or govern their usage of knowledge across this continuum. In this study chaperoning knowledge refers to how an individual weighs and ultimately judges the correctness or value of a potential solution to a problem. This study is not concerned with the intelligence or iq of a participant. Only with how they judge the value of a potential solution. Based on research already completed and cited earlier in this article it is presumed that liberals will be more likely to judge the value or correctness of a solution by chaperoning their knowledge with compassion. While conservatives will be more likely to judge the value or correctness of a solution to a problem by chaperoning their knowledge with logic.
It is assumed that in both ideologies (conservative and liberal) that there are an equal percentage of intellectuals, mid-level intellects, and lower level intellects. Yet, these groups look at the same societal problems, and make very different judgements regarding the value of potential solutions. If it is true that liberals chaperone their knowledge with more emphasis on compassion, then it makes sense that they would judge the best potential solution to a problem to be the one that appears to be most compassionate. Whereas, if it is true that conservatives tend to chaperone their knowledge with more emphasis on logic, then it makes sense that they would judge the best solution to be the one that appears to be most logical.
Just as knowledge seeking seems to divide American politics across religion and science, so too does knowledge chaperoning divide people across an axis of compassion and logic. Again, keeping in mind that the polar ends of this second axis could just as aptly be named emotion and organization, or empathy and structure, as other studies have referred to them.
By charting a representative sample of the population across these two axes (knowledge seeking and knowledge chaperoning) on a bidimensional knowledge matrix, it should be possible to observe statistical patterns that can be used to broadly describe the larger makeup of the American body politic. As well as the characteristics of individuals within that same context. In other words it should be possible to see what types of individuals make up liberalism, conservatism, and political centrism. As well as identify how specific populations of individuals within each quadrant of such a bidimensional knowledge matrix fare in life, in terms of income, education, emotional wellbeing and so forth.
Questions, such as whether belonging to any particular quadrant of this bidimensional knowledge matrix is more beneficial than belonging to another quadrant can be explored As well as the impact that being either closer to the center of the matrix, or alternatively farther away from the center of the matrix might have on the lives and wellbeing of individuals. Thus, the principle questions of this study are as follows:
- Are there statistically significant patterns for how individuals fall across a bidimensional knowledge matrix?
- If so, can these patterns be used to predict the degree of success that an individual is likely to attain in life, in terms of income, education, career, and happiness?
- Can identifying and understanding these patterns be used to help ease the animosity that currently exists between the political ideologies by creating increased understanding amongst them.
Methods
Creation of A Bidimensional Knowledge Matrix
A key component of this study is the creation of a bidimensional knowledge matrix. With one axis representing knowledge seeking attitudes and the other representing knowledge chaperoning attitudes.
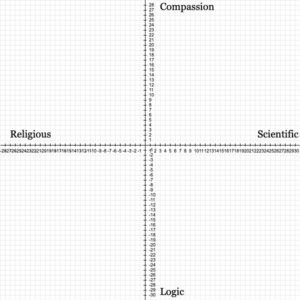 Either of the two principal continuums being tracked could have been selected to represent the x or y axis of the matrix. Likewise either of the two poles for each continuum could have been assigned as positive or negative for these axes. Given that this is ultimately irrelevant to the results, the knowledge seeking continuum was assigned to the x axis. With “Religion” representing the negative side and “Scientific” representing the positive side. The knowledge chaperoning continuum was assigned to the y axis. With “Logic” representing the negative side, and “Compassion” representing the positive side.
Participants
Participants were sought through MTurk. Which has been shown to provide a reasonably representative sample of the American public. These participants were selected based on their geographic location, The United States, and their age, 18 or older. In order to ensure quality results, participants were required to have a 95% approval rating on MTurk and to have completed at least 100 HITs already. The survey was open to 800 HITs. However, only 526 participants completed it.
The Questionnaire
The questionnaire consisted of 120 questions, which were randomized prior to each administration so as to obscure the intent of what was being collected. Before randomization this survey consisted of four parts. The first 20 questions Appendix I. were designed to determine whether or not an individual actively seeks knowledge. These questions were presented to participants in the form of a Likert Scale, Where participants were asked to specify how strongly a given statement represented their views. The scale ranged from Strongly Agree (5), Agree (4), Neutral (3), Disagree (2), and Strongly Disagree (1). Ten of these questions were asked using positive phrasing, e.g. “I enjoy learning.”, “I spend a portion of each day pursuing knowledge.”, and “When it comes to learning I am self motivated.” While ten questions were asked using negative phrasing, e.g. “Learning new things does not interest me at this stage in my life.”, “It is hard for me to motivate myself to learn new things.”, and “I do not enjoy learning.” The totals from the positively and negatively phrased questions were summed in order to provide a final score.
The second part of the questionnaire included 20 questions designed to measure whether or not an individual actively chaperones their knowledge. These questions followed the same pattern. With ten being positively phrased and ten being negatively phrased. They were also analyzed in the same way.
At this initial stage it was important to determine whether or not a participant actively sought and / or chaperoned their knowledge. If a participant did not actively engage in either knowledge seeking or knowledge chaperoning then there would be little value in attempting to classify where they fell when it comes to how they go about each of these activities.
The third part of the survey Appendix I consisted of 40 questions which were also presented to participants on a Likert scale. These questions were designed to classify how individuals seek knowledge and also how they chaperone their knowledge. These questions only applied to those individuals where the previous questions had indicated that they both actively sought and also actively chaperoned their knowledge. The first ten of these questions were designed to measure an individual’s trust level for religion based sources. The next ten questions were designed to measure an individual’s trust level for scientific sources. The third set of ten questions were designed to measure an individual’s inclination towards chaperoning their knowledge with logic, and the final ten questions were designed to measure an individual’s inclination towards chaperoning their knowledge with compassion. The questions representing the knowledge seeking axis (subset 1 / religion, and subset 2 / Science) were compared to each other, and the questions representing the knowledge chaperoning axis (subset 3 / logic, and subset 4 / compassion) were also compared to each other. Because we assigned religion and logic as the negative x, y values in the bidimensional knowledge matrix, these were subtracted from the positive x, y scores for science and compassion. Which resulted in a final plottable x,y set of coordinates that could be graphed on the bidimensional knowledge matrix.
The fourth and final part of the survey consisted of 40 questions Appendix I that covered a variety of topics relating to demographics. Such as income levels, education levels, relationship success, self-reported happiness and so forth. The purpose of these questions was to look for any positive or negative correlations that might exist between where an individual graphs on the bidimensional knowledge matrix, and how these individuals fare in life.
Data Analysis
The following procedures were used to calculate and analyze the data that was collected.
Calculating Dimensionality.
Before an individual could be graphed on the bidimensional knowledge matrix it was necessary to first determine whether or not they actually perform in the area being measured. Charting someone’s location in terms of whether they seek knowledge more from religion or more from science would be meaningless if the individual doesn’t actively seek any learning at all. Likewise, charing someone’s location in terms of whether they chaperone their knowledge with compassion or with logic also would be meaningless if they don’t chaperone their knowledge.
To test for knowledge seeking and knowledge chaperoning, a score was generated for each participant based on how they responded to the survey questions for both knowledge seeking and knowledge chaperoning, as described earlier. If the score that resulted was positive then individuals were determined to be measurable to at least to some degree for that axis. If the score of an individual was negative for either axis, then they were said to be unidimensional. In that they could only be graphed on one axis but not the other. If the score of an individual was negative for both axes then the individual was said to be a “nonengager.” Indicating that they neither actively sought knowledge nor chaperoned the knowledge that they did have.
Unidimensional participants were placed on their own graphs Appendix IV separate from those on the bidimensional knowledge matrix. Nonengers were not graphed at all.
Calculating Location On A Bidimensional Knowledge Matrix.
For those participants where it was demonstrated that they both actively sought and also actively chaperoned their knowledge it was necessary to further test them, in order to measure the degree to which they registered for each of these axes on the matrix so that they could be plotted on the graph.
It was assumed that the poles for either axis were not mutually exclusive. In other words, it was assumed that someone could be both highly inclined towards compassion and also highly inclined towards logic. Likewise, it was assumed that a person could show a high degree of trust for both science and also for religion. Thus an accurate score had to take this into account by reflecting not just the degree to which an individual registered for one of these extremes, but rather the degree to which they register for both.
To calculate a score for knowledge seeking (Religion vs Science) participants were asked a series of questions designed to measure their trust of both religion and science. With religion being assigned a negative value and science being assigned a positive value. Thus as an example, a person who scores (30+) for science and (20-) for religion would end up with a net knowledge seeking score of (10+). The same process was used to calculate the scores for knowledge chaperoning. The net knowledge seeking score was used to graph the participant’s x position on the bidimensional knowledge matrix while the net knowledge chaperoning score was used to graph their y position.
Recognizing The Importance of Both Central Proximity And Degree.
An participant whose scores are equally balanced on either side of an axis will chart nearer to the center of that axis, regardless of the degree to which they register for the two extremes being measured. For example, someone who scores a (5-) for religious trust and a (5+) for scientific trust will have a net knowledge seeking score of (0). The same would be true of someone who scored a (50-) for religious trust and a (50+) for scientific trust. Yet these two individuals are clearly very different from one another. To account for this reality on the graph each of the dots representing individuals were divided into two parts. With the inner dot representing the knowledge seeking score, and the outer dot representing the knowledge chaperoning score. The larger each dot appears on the graph the higher their degree (raw scores) were on either side of the axis. Thus in the earlier example, the participant who has scores of (5-) and (5+) would show up on the graph with a very small dot, while the participant whose scores are (50+) and (50-) would show up with a much larger dot.
It was also necessary to account for this in the final analysis of the data so that meaningful inferences could be drawn. To do this it was necessary to calculate a Central Proximity Ratio that considers both proximity and degree. The process for calculating this ratio is described below.
Calculating The Central Proximity Ratio.
The central proximity ratio for a participant, is a score that takes into account both their location in terms of their distance from the center of the bidimensional knowledge matrix, as well as the degree to which their raw scores were either high or low. This ratio is calculated by dividing the individual’s central proximity by the mean raw scores for all four (Religion, Science, Logic, Compassion) metrics being measured. Calculating an individual’s central proximity requires simply determining how far from the center (0,0) point of the bidimensional knowledge matrix that a participant graphs.
This was accomplished using the following formula: Central Proximity=√((0-NKS)²+(0-NKC)²) where NKS is the net knowledge seeking score and NKC is the net knowledge chaperoning score. The mean raw scores for all four metrics was calculated as follows: (Science+|Spiritual|+Logic+|Compassion|)/4.
Lastly the Central Proximity Ratio was calculated as follows: CPR=CP/MRS. Where CP refers to Central Proximity and MRS refers to the mean raw scores for each metric. The result is a useful score that can be used in data analysis calculations. Thus, the lower a participant’s CPR was, the greater that both their central proximity and their degree of diversity between both sides of an axis was.
Negative And Positive Correlations For Wellbeing.
The last thing that this study tracked was the wellbeing of participants in terms of education, career, income, happiness, relationships and so forth. The goal being to determine whether or not there was a correlation between where a person registered on this bidimensional knowledge matrix and how they fared in life. To that end the research focused on different areas of the matrix and calculations were performed to determine the mean income, happiness level, education level and so forth for those participants whose scores placed them in each region. This included looking at all four quadrants of the graph, as well as at central proximity vs distance from central proximity (discussed later in this article).
Limitations
While 526 respondents is a reasonable number of participants, when these are spread across multiple quadrants they become less and less significant. Especially when these are further subdivided between political ideologies and other measures. To account for this, the researcher was careful not to draw any conclusions where there simply was not enough data to justify inferences being drawn. Another limitation came from the fact that this is the first time this model has been conceived of or tested. As such, it was not possible to predict in advance which information would be relevant, and which would not. As a result, some of the survey questions were not sufficiently detailed, resulting in a potentially lower effect size as will be discussed later in this article. Additionally, there are undoubtedly issues relating to the internal reliability of the first 80 questions that were used to chart individuals on the bidimensional knowledge matrix. Efforts were made to carefully define the question parameters and to write questions that would remain true to these parameters. However, in future studies it would be helpful to review the questions used in this study for internal reliability and to adapt the questionnaire accordingly.
Results
This study included two separate sets of data. The first set which was collected through the first 80 questions of the questionnaire was designed to address the first research question:
Are there statistically significant patterns for how individuals fall across a bidimensional knowledge matrix?
The second set of data was derived from the final 40 questions of the questionnaire and was collected in order to answer the second research question:
If so, can these patterns be used to predict the degree of success that an individual is likely to attain in life, in terms of income, education, career, and happiness?
Bidimensional Knowledge Matrix, Raw Data
This table contains the raw data that was collected from 526 volunteers who responded to the survey via MTurk. This data has been ordered per the process described earlier in this article.
| All | Lib | Con | Cent | |
| Nonengagers | 3% (17) | 2% (3) | 4% (10) | 4% (4) |
| Unchaperoned Knowledge Seekers | 13% (68) | 7% (14) | 18% (42) | 13% (12) |
| Chaperoned Nonseekers of Knowledge | 10% (55) | 8% (15) | 12% (28) | 11% (10) |
| Quadrant A | 3% (16) | 1% (2) | 4% (10) | 3% (3) |
| Quadrant B | 13% (67) | 24% (44) | 5% (12) | 5% (5) |
| Quadrant C | 3% (16) | 1% (2) | 5% (11) | 2% (2) |
| Quadrant D | 13% (66) | 17% (32) | 9% (20) | 14% (13) |
| Central Proximity < 7 | 40% (210) | 37% (70) | 41% (94) | 46% (42) |
| Central Proximity > 7 | 33% (174) | 45% (85) | 25% (57) | 25% (23) |
All: All Participants, Lib: Liberals, Con: Conservatives, Cent: Political Centrist
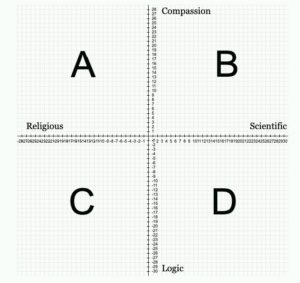
Figure 1
Nonengagers refer to those individuals who do not register for either knowledge seeking or knowledge chaperoning. Unchaperoned knowledge seekers refer to individuals who actively seek knowledge, but who do not chaperone their use of it. Chaperoned nonseekers of knowledge refer to individuals who do not actively seek learning, but who do chaperone the knowledge they have. Quadrants A-D refer to individuals whose scores place them in a specific part of the bidimensional knowledge matrix. (see fig. 1) A central proximity that is less than 7 refers to individuals whose scores place them within 7 degrees of center. (see fig. 2) A central proximity greater than seven refers to individuals who are bidimensional but who fall outside of a central proximity of 7. It is worth noting that quadrants A-D contain individuals who fall both within and without a central proximity of 7.
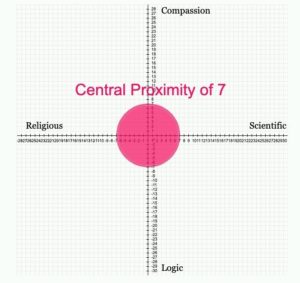
Figure 2
The following diagrams show how participants charted on this bidimensional knowledge matrix. Note that the political ideology of participants was self-reported by the individuals.
Light and dark blue dots represent liberals, with light blue being those who self-reported as moderately liberal, and dark blue being those who self-reported as extremely liberal. Light and dark red dots represent conservatives. With light red being those who self-reported as moderately conservative and dark red representing those who self-reported as extremely conservative. Green dots represent individuals who self-reported as being political centrists. White dots represent participants who did not report their political affiliation.
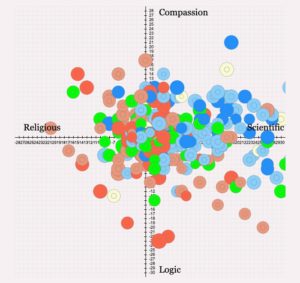
Figure 3
Figure 3 shows the results of all 526 volunteers. Figure 4 shows the results of conservatives and liberals. Figure 5 shows the results of only liberals. Figure 6 shows the results of only conservatives. Figure 7 shows the results of graphing those who self-reported as being political centrists.
Again, as discussed earlier in this article each dot is divided into two parts. With an inner dot and an outer dot. The size of the inner dot is based on the degree to which a person scores highly on the religion vs scientific axis (x-axis). Those participants scoring a higher degree or score have a larger dot. The size of the outer dot is based on the degree to which a person scores highly on the compassion vs logic axis.
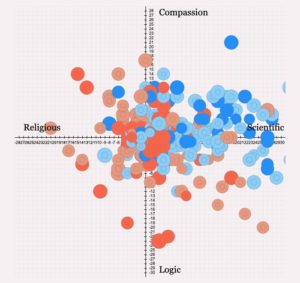
Figure 4
Common Patterns Observed
Effect / Impact On Participants, Raw Data
As discussed earlier in this article the second part of this study was designed to explore whether or not the location of a participant on this bidimensionality knowledge matrix would show a positive correlation for various aspects of wellbeing, and if so, to what extent.
This table contains the raw data that was collected from the second half of the questionnaire.
| Income | Happiness | Education | Relationship status | Trust For The Other Party | |
| All | $52.54K | 3.175 | 15.49 Years | 2.66 | 1.06 |
| Quadrant A | $42K | 3.142 | 16.14 Years | 2.42 | 1.23 |
| Quadrant B | $47.83K | 3.045 | 15.4 Years | 2.22 | 1.11 |
| Quadrant C | $59.85K | 3.5 | 14.42 Years | 3.42 | 1.21 |
| Quadrant D | $49.88K | 2.98 | 15.15 Years | 2.49 | 0.88 |
| Central Proximity < 7 | $55.63K | 3.262 | 15.65 Years | 2.82 | 1.1 |
| Central Proximity < 7
CPR < 0.2 |
$55.08K
SD (6.45) SS (161) |
3.268
SD (1.0984) SS (161) |
15.7 Years
SD (1.74) SS (161) |
2.83
SD (2.5) SS (161) |
1.1
SD (0.936) SS (161) |
| Central Proximity > 7 | $48.89K
SD (6.52) SS (146) |
3.075
SD (1.0191) SS (146) |
15.31 Years
SD (1.88) SS (146) |
2.49
SD (2.52) SS (146) |
1
SD (1.105) SS (146) |
| Effect Size | 0.954497 | 0.182163 | 0.215309 | 0.135457 | 0.097657 |
| Impact | 11.20% | 6% | 2.50% | 12.10% | 9.10% |
SD: Standard Deviation
SS: Sample Size
CPR: Central Proximity Ratio
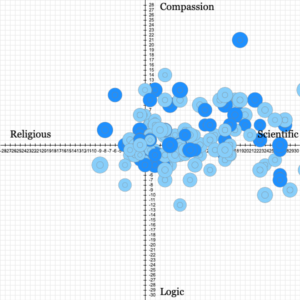
Figure 5
The data for income, happiness, education, relationship status, and trust for the other party are self-reported and based on various classifications, which are all included in Appendix I. For each category a higher score denotes more success, while a lower score denotes less success.
The impact percentage reported for each category was calculated by contrasting the mean performance of participants with both a central proximity of less than 7, and a central proximity ratio of less than 0.2, against participants with a central proximity greater than 7.
The effect size for each category was calculated using Cohen’s d formula (Cohen, 1992), and is based on the same comparison that was used to calculate the impact. While
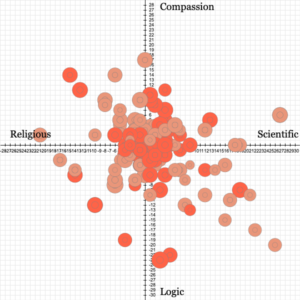
Figure 6
most of these effect sizes are small, it is important to account for the fact that these small effect sizes are very likely due to an error in the questionnaire which will be explained in the discussion section of this article.
Discussion
Research Question 1: Are there statistically significant patterns for how individuals fall across a bidimensional knowledge matrix?
There are two distinct trends in the data, which each support the disparate findings of previous researchers on opposing sides of the debate regarding whether or not ideology plays a
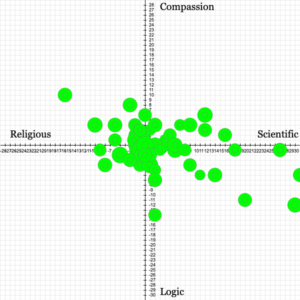
Figure 7
role in political party affiliation. Those participants who fall within a central proximity of 7 are largely homogeneous in their views (40% of respondents). While those who fall outside of a central proximity of 7 are much more heterogeneous (60% of respondents).
The first group (CP<7) confirm the findings of past researchers who have found that ideology plays very little to no role in party affiliation. (Malka, A., Lelkes, Y., 2010)(Baldassari, D., & Gelman, A., 2008) While the second group (CP>7) confirm the findings of researchers who have found that ideology has at least some degree of impact on party affiliation. (Carney, D. R., Jost, J. T., Gosling, S. D., & Potter, J. f, 2008) (Ashton, M. , Paunonen, S. , Helmes, E. , & Jackson, D., 1998)
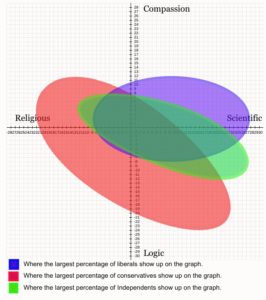
Figure 8
For those participants who had a central proximity less than 7 there was virtually no distinct or recognizable pattern evident based on the political party that someone claims affiliation with. However, once we looked outside of this central proximity of 7 several patterns became apparent.
Liberals Occupy Quadrant B
One of the most interesting findings was that liberals who are outside of a central proximity of 7 tend to dominate Quadrant B. Which represents persons who seek knowledge from scientific sources, and who chaperone their knowledge with compassion.
Conservatives Occupy Quadrants A, C, D
Another interesting finding was how few conservatives occupied Quadrant B, amongst those with a central proximity greater than 7. Most conservatives outside this zone tended to chart in Quadrants A, C, and D. With the largest number graphing in Quadrant D. Which represents persons who seek knowledge from scientific sources and chaperone their knowledge with logic. A significant number also appeared in Quadrants A and C, which both seek knowledge from religious sources.
Centrists Occupy Quadrant D
Participants who self-reported as political centrists, also showed little variation within a central proximity of 7. Those who fell outside this zone mostly charted in quadrant D.
Examples of Extreme Deviation
In all cases (liberal, conservative, centrist) there were examples of individuals who self-reported as belonging to one political ideology but who then chartered very differently from the rest of the participants who shared their ideology. This was more common amongst conservatives, and much less so amongst liberals and centrists who each charted more consistently in the same region of the bidimensional knowledge matrix.
How was the research question answered?
The data suggests that there are very definite and predictable patterns to how individuals chart on a bidimensional knowledge matrix.
Research Question 2: If so, can these patterns be used to predict the degree of success that an individual is likely to attain in life, in terms of income, education, career, and happiness?
There were distinct characteristics that emerged in many of the quadrants relating to an individual’s wellbeing. For example individuals in Quadrant A had the overall highest education rates, while those in Quadrant C reported the highest incomes, happiness levels, and relationship success. However, the most statistically significant results came from contrasting those with a central proximity of less than 7 and a central proximity ratio less than 0.2 against participants who had a central proximity greater than 7.
Central Proximity Less Than 7 / Central Proximity Ration Less Than 0.2
The participants who fell inside this zone had higher incomes, happiness levels, higher education levels, and were more trusting of the other political ideology than those who fell outside of this zone. Of particular interest is the effect size for income. Which was 0.95. Meaning that there is a strong positive correlation between being inside of this zone and earning a higher income.
Low Effect Size For Happiness, Education, Relationship Status, and Trust of The Other Party
The effect size for the other categories that were tracked by this study were very low. However, this is likely due to poor design of the questionnaire. When this study was conceived the researcher did not know what results might be significant. As such, some of the questions were too limited in scope. Not offering respondents enough degree of variation. For example, in the case of income, participants had the option to select between seven different levels or categories of income. However, in the case of happiness they only had the option to select between three levels. Thus with the degree of options artificially narrowed down to such a small scope, the standard deviation was magnified. Resulting in a lower effect size. It is possible that these effect sizes are accurate. However additional research needs to be completed to determine whether or not this is the case.
How was the research question answered?
The data shows that in the case of income, happiness, relationship status, education, and trust of the other party that there is an impact that results from having a central proximity less than 7. In the case of income the effect size is statistically significant. Further research needs to be completed to further explore this question and to clarify the effect size of other categories, as well as to explore other categories of well being, and how they relate to an individual’s location on a bidimensional knowledge matrix.
Research Question 3: Can identifying and understanding these patterns be used to help ease the animosity that currently exists between the various political ideologies by creating increased understanding amongst them.
This question was not directly addressed within this study. Additional research would be needed to say what impact the understanding of this model can have on helping to ease the general animosity that currently exists within the body politic.
However, this question was addressed indirectly, in that it shows how a person can benefit from having a lower central proximity.
It can be reasonably assumed that teaching the public to understand how those of the other political ideology think can lead to increased peace. For example, helping the public understand that the other political ideology might trust different sources of “truth” could help communicators better target and frame their arguments. Likewise, helping the public understand that the other political ideology might judge the correctness of a solution to a problem based on a different criteria, could help all sides to work together to come up with more pragmatic solutions.
Liberals often do not understand how it is that conservatives can get behind the solutions they do. Likewise, conservatives often cannot understand why liberals get behind the solutions that they do. This study provides a framework for encouraging more understanding. By illustrating that it isn’t that one side is right, and the other is wrong, but instead that both sides are judging the value of what is the correct solution based on different criteria. Those who chaperone their knowledge using logic will judge a different option to be more right than those who chaperone their knowledge with compassion.
Lastly, understanding this matrix can help illustrate how alike the two ideologies are, and how much they have in common.
It is recommended that additional research be done in order to explore how a bidimensional knowledge matrix can be used in course development, in cross political dialogue, in communication, such as writing, news reporting, and so forth. So that individuals from across the bidimensional knowledge matrix can be more adequately communicated with, and more effectively worked with to solve problems.
References Used For Part I (The Science of Division)
Ariel Pomputius. (2019) Can You Hear Me Now? Social Listening as a Strategy for Understanding User Needs. Medical Reference Services Quarterly 38:2, pages 181-186. Retrieved On December 13, 2020 From https://www.tandfonline.com/doi/abs/10.1080/02763869.2019.1588042
Bennett, A. (1999). Subcultures or Neo-Tribes? Rethinking the Relationship Between Youth, Style and Musical Taste. Sociology, 33(3), 599–617. Retrieved December 14, 2020 from https://doi.org/10.1177/S0038038599000371
Braithwaite A. It’s About Ethics in Games Journalism? Gamergaters and Geek Masculinity. Social Media + Society. October 2016. doi:10.1177/2056305116672484 Retrieved December 13, 2020 from https://journals.sagepub.com/doi/10.1177/2056305116672484#articleCitationDownloadContainer
Christopher C. Gearhart, Sarah K. Maben. (2019) Active and Empathic Listening in Social Media: What do Stakeholders Really Expect. International Journal of Listening 0:0, pages 1-22. Retrieved on December 13, 2020 From https://www.tandfonline.com/doi/abs/10.1080/10904018.2019.1602046
Colburn, A. (2007) Constructivism And Conceptual Change, The Science Teacher. Vol. 74, No. 8
Crawford, K. (2009). Following You: Disciplines of Listening in Social Media. Continuum, 23(4), 525–535. https://doi.org/10.1080/10304310903003270 Retrieved On December 14, 2020
James, P. (2006). Globalism, Nationalism, Tribalism (Vol. 2). London: Sage Publications.
Margaret C. Stewart, Christa L. Arnold. (2018) Defining Social Listening: Recognizing an Emerging Dimension of Listening. International Journal of Listening 32:2, pages 85-100. Retrieved On December 14, 2020 From https://www.tandfonline.com/doi/abs/10.1080/10904018.2017.1330656
Massanari, A. L. (2017). “Come for the Period Comics. Stay for the Cultural Awareness”: Reclaiming the Troll Identity Through Feminist Humor on Reddit’s/r/TrollXChromosomes. Feminist Media Studies, 1–20. https://doi.org/10.1080/14680777.2017.1414863
Mills, R. A. (2017). Pop-up Political Advocacy Communities on reddit.com: SandersForPresident and the Donald. AI & Society, 1–16. Retrieved On December 13, 2020 From https://doi.org/10.1007/s00146-017-0712-9
Robards, B., & Bennett, A. (2011). MyTribe: Post-subcultural Manifestations of Belonging on Social Network Sites. Sociology, 45(2), 303–317. https://doi.org/10.1177/0038038510394025
Sharon L. Storch, Anna V. Ortiz Juarez-Paz. (2018) Family Communication: Exploring the Dynamics of Listening with Mobile Devices. International Journal of Listening 32:2, pages 115-126. Retrieved On December 13, 2020 From https://www.tandfonline.com/doi/abs/10.1080/10904018.2017.1330657
Van Der Nagel, E., & Frith, J. (2015). Anonymity, Pseudonymity, and the Agency of Online Identity: Examining the Social Practices of r/Gonewild. First Monday, 20(3), 1–12. Retrieved On December 14, 2020 From https://journals.uic.edu/ojs/index.php/fm/article/download/5615/4346
References Used For Part II (How People Can Unite)
Abramowitz, A. I., & Saunders, K. L. (2006). Exploring the bases of partisanship in the American electorate: Social identity vs. ideology. Political Research Quarterly, 59, 175–187.
Ashton, M. , Paunonen, S. , Helmes, E. , & Jackson, D. ( 1998). Kin altruism, reciprocal altruism, and the Big Five personality factors. Evolution and Human Behavior, 19(4), 243-255.
Baldassari, D., & Gelman, A. (2008). Partisans without constraint: Political polarization and trends in American public opinion. American Journal of Sociology, 114, 408–446.
Barbour, Ian, 2000, When Science Meets Religion: Enemies, Strangers, or Partners?, New York: HarperCollins.
Bennett, A. (1999). Subcultures or Neo-Tribes? Rethinking the Relationship Between Youth, Style and Musical Taste. Sociology, 33(3), 599–617. Retrieved December 14, 2020 from https://doi.org/10.1177/S0038038599000371
Bloom, B. S.; Engelhart, M. D.; Furst, E. J.; Hill, W. H.; Krathwohl, D. R. (1956). Taxonomy of educational objectives: The classification of educational goals. Handbook I: Cognitive domain. New York: David McKay Company.
Bransford, John D. and Stein, Barry S., “The Ideal Problem Solver” (1993). Centers for Teaching and Technology – Book Library. 46.
Carney, D. R., Jost, J. T., Gosling, S. D., & Potter, J. (2008). The secret lives of liberals and conservatives: Personality profiles, interaction styles, and the things they leave behind. Political Psychology, 29, 807–840.
Cohen, J (1992). “A power primer”. Psychological Bulletin. 112 (1): 155–159. doi:10.1037/0033-2909.112.1.155. PMID 19565683.
Cova, B., & Cova, V. (2002). Tribal Marketing: The Tribalisation of Society and Its Impact on the Conduct of Marketing. European Journal of Marketing, 36(5–6), 595–620.
Goddard RD, Hoy WK, Hoy AW. Collective Teacher Efficacy: Its Meaning, Measure, and Impact on Student Achievement. American Educational Research Journal. 2000;37(2):479-507. doi:10.3102/00028312037002479
Hirsh JB, DeYoung CG, Xu X, Peterson JB. Compassionate Liberals and Polite Conservatives: Associations of Agreeableness With Political Ideology and Moral Values. Personality and Social Psychology Bulletin. 2010;36(5):655-664. doi:10.1177/0146167210366854
James, P. (2006). Globalism, Nationalism, Tribalism (Vol. 2). London: Sage Publications.
Harrison, Peter, 2015, The Territories of Science and Religion, Chicago: University of Chicago Press.
Malka, A., Lelkes, Y. More than Ideology: Conservative–Liberal Identity and Receptivity to Political Cues. Soc Just Res 23, 156–188 (2010). https://doi.org/10.1007/s11211-010-0114-3
Maslow, A. H. (1943). A theory of human motivation. Psychological Review, 50(4), 370–396. https://doi.org/10.1037/h0054346
Menon, T., Thompson, L., & Choi, H.-S. (2006). Tainted Knowledge vs. Tempting Knowledge: People Avoid Knowledge from Internal Rivals and Seek Knowledge from External Rivals. Management Science, 52(8), 1129–1144. https://doi.org/10.1287/mnsc.1060.0525
Mills, R. A. (2017). Pop-up Political Advocacy Communities on reddit.com: SandersForPresident and the Donald. AI & Society, 1–16. Retrieved On December 13, 2020 From https://doi.org/10.1007/s00146-017-0712-9
Robards, B., & Bennett, A. (2011). MyTribe: Post-subcultural Manifestations of Belonging on Social Network Sites. Sociology, 45(2), 303–317. https://doi.org/10.1177/0038038510394025
Skinner, B. F. (1938). The behavior of organisms: An experimental analysis. New York: Appleton-Century.
Stenmark, Mikael, 2004, How to Relate Science and Religion: A Multidimensional Model, Grand Rapids, MI: Eerdmans.
Webb, Norman L. and others. “Web Alignment Tool” 24 July 2005. Wisconsin Center of Educational Research. University of Wisconsin-Madison. 2 Feb. 2006. <http://www.wcer.wisc.edu/WAT/index.aspx>.